EUR/USD — Between Rate Divergence and Energy Shock: A Currency Pair at the Crossroads
Date: May 4, 2026 | Current Rate: 1.1700 | Change: +0.06% | Ticker: EUR/USD
The Asset in Context
EUR/USD is the world’s most actively traded currency pair and reflects, more than any other market, the shifting balance of power between two major economic blocs. At a current price of 1.1700, the pair trades near the Fibonacci 38.2% retracement level (1.1718) of its 52-week range between 1.1100 and 1.2100 — a technically significant equilibrium zone. The year’s roughly ten-cent range illustrates how dramatically the balance of forces has shifted: from a dollar-dominated winter environment to a progressively euro-supportive dynamic shaped by monetary policy divergence, geopolitics, and energy prices.
Macro Forces at Play
The dominant structural tension driving EUR/USD in recent months is the widening monetary policy asymmetry between the Federal Reserve and the European Central Bank. The Fed holds its benchmark rate at 3.75%, following its third 25-basis-point cut of 2025 in December, and has since signalled a determined pause. The official US inflation rate stands at 3.3% (CPI) as of March 2026, with core inflation at 2.6% — both stickier than markets had anticipated last autumn. US GDP grew at an annualised 2.0% in Q1 2026, a deceleration from the prior quarter but far from recessionary. With an unemployment rate of 4.3%, the labour market sends no distress signal; the FOMC accordingly has little reason to loosen in the near term, and futures markets price in at most one further cut for the full year of 2026.
Across the Atlantic, the ECB held rates unchanged at its April 30 meeting — deposit facility rate at 2.00% — and revised its 2026 inflation forecast sharply higher, from 1.9% to 2.6%, on the back of energy prices inflated by the Iran conflict. Eurozone core inflation stands at 2.2%, and German energy inflation has surged to 10.1%. Morgan Stanley has abandoned its prior forecast of two ECB rate cuts in 2026, now pencilling in the next possible easing steps only for June and September 2027. Prediction market Polymarket assigns just a 14% probability to any ECB rate cut occurring before December 2026. The combined effect — US rate stickiness and now a hawkish ECB recalibration — creates a paradoxical dynamic: while the interest rate differential (Fed at 3.75% vs. ECB at 2.00%) remains structurally dollar-supportive, markets increasingly price in the drag that Trump-era tariffs and trade uncertainty impose on the US economy, which acts as a sustained brake on the greenback. Germany’s unemployment rate of 6.4% and the eurozone’s current account surplus of 1.7% of GDP provide a structural floor for the euro.
Supply, Demand and Market Structure
The structural capital flow backdrop favours the euro over the medium term. The eurozone runs a current account surplus of 1.7% of GDP — a fundamental anchor that supports the single currency during corrections. The United States, by contrast, carries a current account deficit of 3.6% of GDP (Q4 2025), requiring a constant inflow of foreign capital and making the dollar more vulnerable to portfolio reallocation. Speculative positioning, as reflected in recent CFTC COT data, shows a modest net long euro position that is far from extended — leaving room for further appreciation without triggering a crowded-trade reversal. Institutional demand for euro-denominated assets has been structurally elevated by Europe’s defence and infrastructure spending programmes, which pull capital flows into the eurozone. The intraday trading band on May 4, 2026 spans 1.1700 to 1.1800, reflecting cautious consolidation following back-to-back central bank decisions. The year high at 1.2100 remains the next gravitational target for bulls.
Geopolitics and Risk Landscape
The Iran ceasefire holds — for now. But the aftershocks continue to reverberate through energy markets. German energy inflation of 10.1% in April 2026 is not an abstraction: it compresses industrial margins, erodes consumer purchasing power, and undermines the growth outlook for the eurozone’s largest economy. For the ECB, this represents a classic monetary dilemma: rate cuts to support growth are virtually off the table while inflation overshoots the 2% target. Meanwhile, Trump tariffs continue to generate global trade uncertainty; any escalation — particularly against European exporters — could briefly revive safe-haven dollar demand and push EUR/USD toward the 1.1600 support. The critical macro swing factor: should energy prices normalise and eurozone inflation fall sustainably below 2%, Morgan Stanley’s base case of ECB rate cuts from mid-2027 onward would open a later window of divergent pressure on the euro. Conversely, if the US economy slows meaningfully under the combined weight of tariffs and restrictive monetary policy, Fed rate cut expectations would accelerate, placing renewed downward pressure on the dollar.
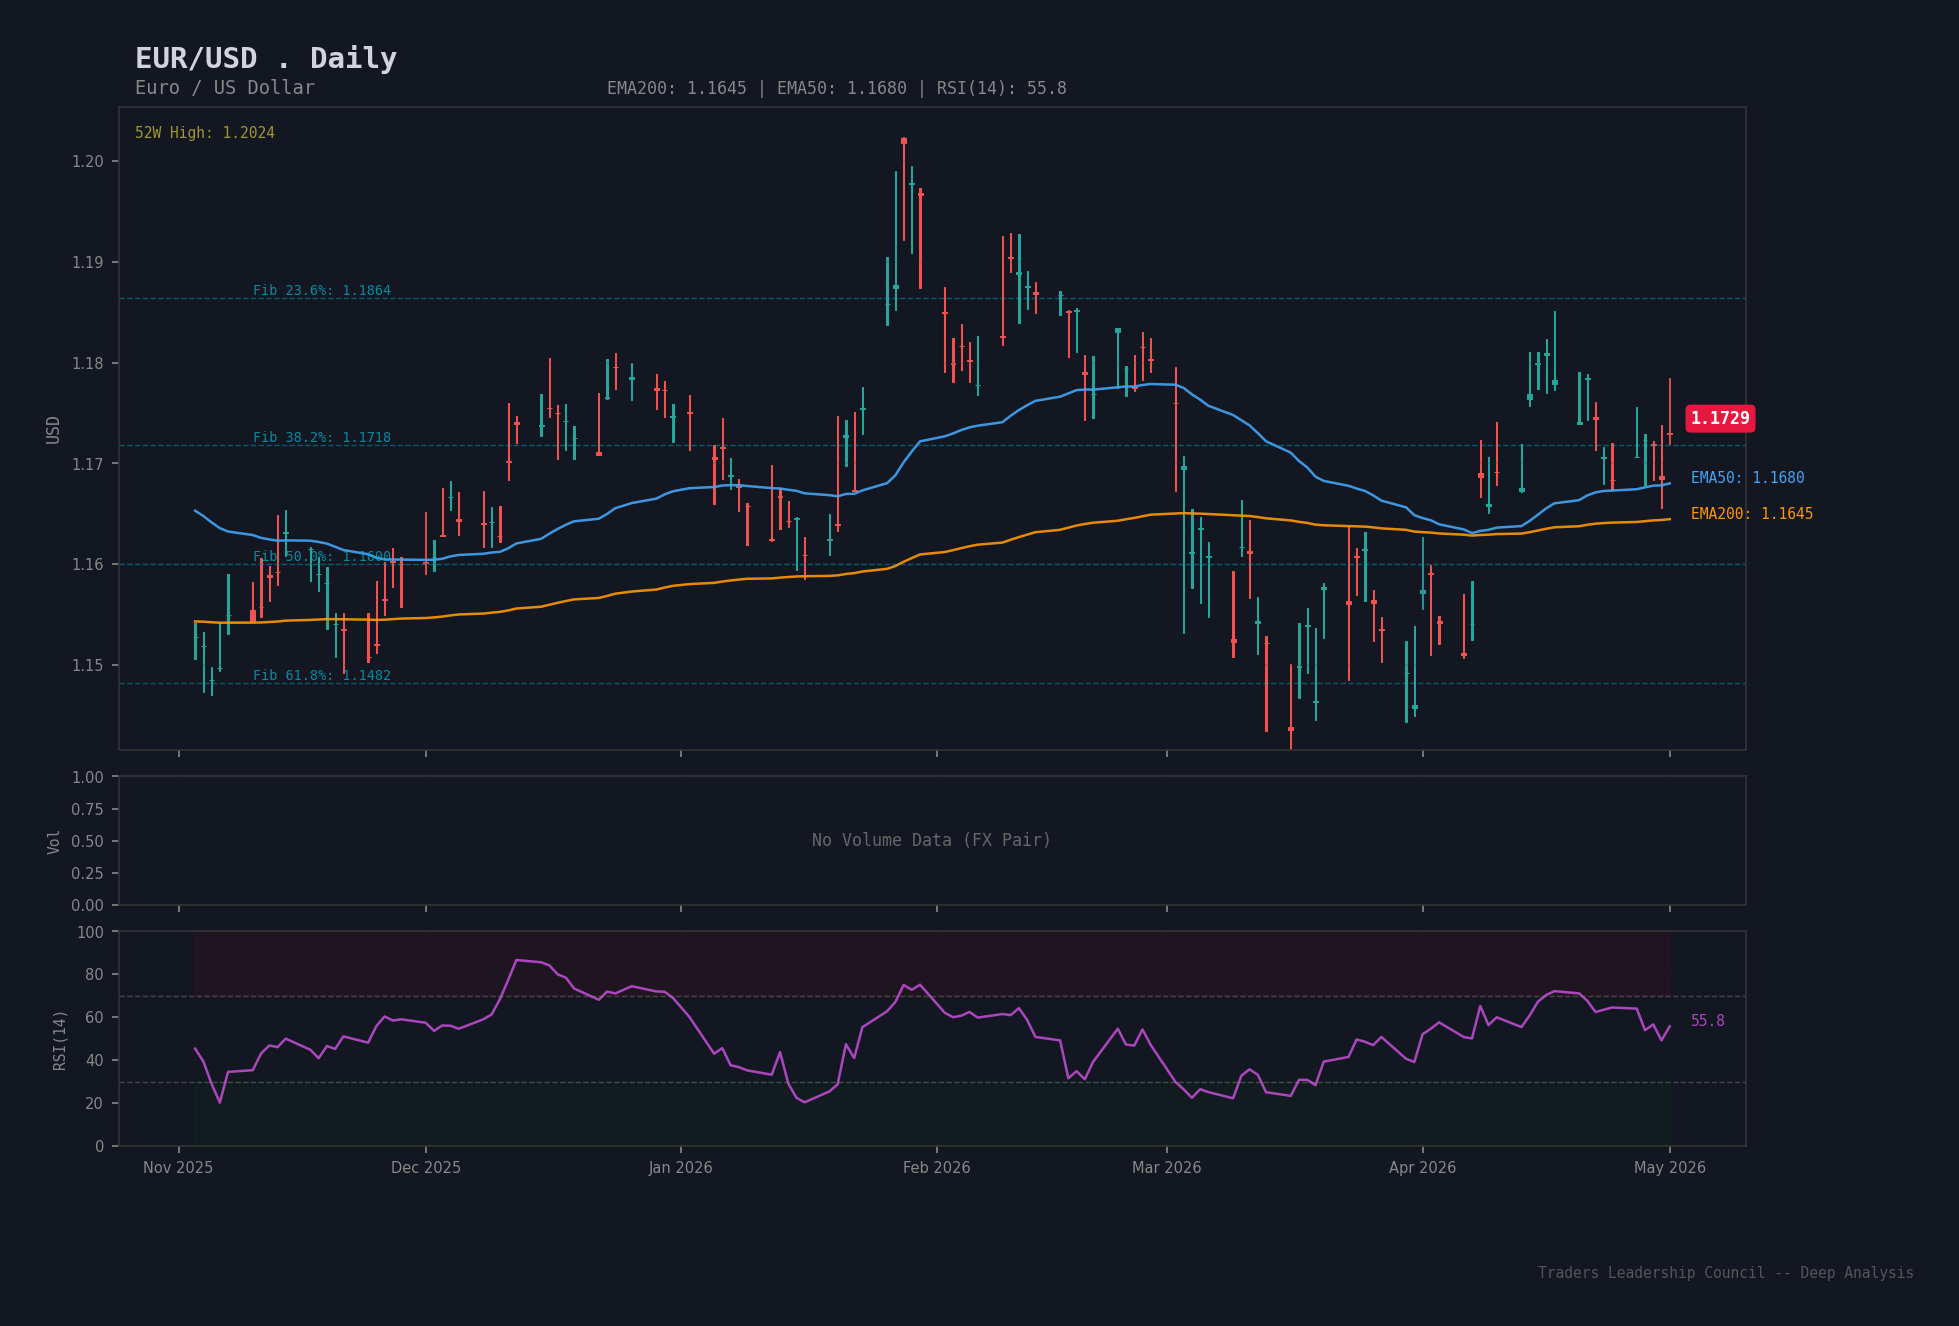
Chart Analysis
Technically, EUR/USD is trading within a well-defined consolidation range. The 52-week span between 1.1100 and 1.2100 generates a Fibonacci grid with actionable levels: the current price of 1.1700 sits almost exactly at the 38.2% retracement (1.1718) — a classic equilibrium where bulls and bears are evenly matched. The 200-day EMA at 1.1482 confirms a clearly upward medium-to-long-term trend, with the current price trading approximately 218 pips above this anchor. The 50-day EMA at 1.1718 converges almost precisely with spot price, signalling momentum neutrality. The RSI(14) at approximately 53 confirms a neutral-to-mildly-bullish momentum reading without overbought distortion. The critical resistance zone lies at the Fibonacci 23.6% level around 1.1864, followed by the year high at 1.2100 as the next major target. On the downside, the 50% Fibonacci level at 1.1600 serves as first support, with the 61.8% level at 1.1482 (converging with the EMA200) as the stronger structural floor. A sustained break below this confluence would materially alter the technical picture.
Risk Factors
US inflation persistence. A further rise in US inflation — driven by tariff pass-through and resilient domestic demand — would force the Fed to hold rates at 3.75% for longer or even contemplate hikes. In this scenario, the rate differential would reassert dollar dominance, pushing EUR/USD toward the 1.1482 support zone (EMA200, Fibonacci 61.8%).
Energy shock and eurozone recession. Should the Iran ceasefire collapse or new conflict fronts emerge in the Middle East, energy prices could spike to levels sufficient to tip the eurozone into technical recession. Germany, already strained by 6.4% unemployment and surging energy costs, would be particularly exposed. This would place the ECB in a difficult stagflation scenario, simultaneously facing above-target inflation and deteriorating growth.
Hawkish ECB surprise. Should incoming eurozone data through June 2026 show accelerating inflation, ECB policymakers could begin signalling rate hikes — triggering an abrupt euro rally that could propel EUR/USD rapidly back toward the year high at 1.2100 and potentially beyond.
Trump tariff escalation. An unexpected intensification of US trade policy targeting Europe — in the context of the digital trade dispute or in retaliation for European counter-tariffs — would drive risk-averse investors into dollar assets and temporarily pressure EUR/USD. The 1.1600 zone (Fibonacci 50%) would serve as the immediate test level.
Geopolitical de-escalation and dollar weakness. An unexpectedly rapid easing of Middle East tensions, combined with a US growth slowdown in H2 2026, would represent the most bullish scenario for EUR/USD: the dollar would lose its safe-haven premium while the eurozone would benefit from lower energy costs. In this scenario, a move above 1.20 during 2026 remains entirely plausible, consistent with forecasts from exchangerates.org.uk projecting EUR/USD at 1.1957 for the year.
Outlook and Key Dates
EUR/USD sits at a technical and fundamental equilibrium that is likely to be resolved by external catalysts in the weeks ahead. The next ECB meeting in June 2026 will confirm whether the bank holds rates firmly or begins signalling any directional shift; the April 2026 US CPI release (mid-May) will be equally decisive for Fed communication and dollar direction. Should the energy price shock fade and eurozone inflation return below 2%, the ECB would regain policy flexibility from 2027 onward — a structurally euro-supportive scenario. Price targets for summer 2026: bull case 1.1950–1.2100, bear case 1.1480–1.1600.
Source and Copyright: Traders’ Leadership Council, 2026.
The content published on this website is provided for general informational purposes only and does not constitute investment advice, a recommendation, or a solicitation to buy or sell any financial instrument. All analyses, assessments, and forecasts reflect the personal opinion of the authors at the time of publication and may contain errors or inaccuracies.
All investment decisions are made at the reader’s own risk. Past performance is not a reliable indicator of future results. Trading financial instruments involves significant risks and may result in total loss of invested capital. Readers should seek qualified, independent financial advice before making any investment decision.
The operator of this website and the authors accept no liability for losses or damages arising directly or indirectly from the use of or reliance on the content published herein.