Copper — Between the Deficit Narrative and the Tariff Endgame
Date: 31 May 2026 | Current Price: 6.39 USD/lb | Change: -0.58% | Ticker: HG
The Asset in Context
Copper is the metal against which the pulse of the world economy is taken — traders call it “Dr. Copper” for good reason. The COMEX high-grade contract closes the week at 6.39 USD per pound, a daily decline of -0.58%, and just a hair below its twelve-month high of 6.72 USD. From its annual low of 4.33 USD the price has broken away powerfully; over the past twelve months it stands up roughly 36.6%. Behind this rally lies no fleeting speculation but a rarely dense constellation of structural supply shortage, energy-transition demand, and a singular US trade-policy situation that is splitting the global copper market in two.
Macro Forces at Play
The macroeconomic backdrop paints a divided picture. The US economy is expanding at an annual rate of 2.7%, yet inflation remains stubbornly above target at 3.8% — a level that hands the new Fed chair, Kevin Warsh, ammunition for his emphatically restrictive stance. The US policy rate sits at 3.75%, and the market prices a meaningful probability of a further hike by year-end. For copper this cuts both ways: a hawkish Fed supports the dollar, and a firmer greenback makes the dollar-invoiced metal more expensive for buyers outside the dollar zone — historically a brake on commodity prices.
Against this stands China, by far the world’s largest copper consumer, still expanding robustly at 5.0% while inflation of just 1.2% leaves ample room for monetary easing and targeted stimulus; its policy rate sits at 3.0%. Any stimulus from Beijing aimed at power grids, housing and electric mobility translates almost immediately into physical copper demand. Europe remains the weak link: Germany manages only 0.4% growth with inflation of 2.6% and an ECB rate of 2.15%. The decisive tension of the market thus lies in the tug-of-war between a dollar-strengthening, demand-dampening US rate cycle and a structural demand wave, carried by global electrification, that is barely fazed by cyclical dips.
Supply, Demand and Market Structure
On the supply side the bottlenecks are intensifying. Treatment and refining charges — the margins smelters earn for processing concentrate — have collapsed, a classic signal of a starved concentrate market. Reuters surveys pointed at the start of the year to a structural deficit on the order of around 150,000 tonnes, even as the International Copper Study Group recently revised its 2026 balance to a slim surplus of roughly 96,000 tonnes (Crux Investor). This discrepancy illustrates how much financial flows — over 87 billion dollars in mining ETFs — have decoupled price formation from physical balance. Structurally, demand remains immense: clean-tech applications alone consumed 6.3 million tonnes of copper worldwide in 2023, nearly 70 percent of it for power grids, with an outlook toward roughly 16 million tonnes by 2040 (Statista/IEA). Added to this is the rapidly growing electricity appetite of AI data centres, which further raises the copper intensity of power infrastructure.
Geopolitics and Risk Landscape
The dominant catalyst is trade-policy in nature. Invoking Section 232, the US has imposed a 50 percent tariff on semi-finished copper products and copper-intensive derivatives since August 2025, extended to the full customs value as of 6 April 2026 (Sandler, Travis & Rosenberg). By 30 June 2026 the Commerce Secretary must deliver to the President a report on the domestic copper market, on the basis of which a decision will be made about a phased universal duty on refined copper — 15 percent from 2027, 30 percent from 2028 (The White House). This late-June deadline is the principal catalyst of the coming weeks and is driving a vigorous tariff arbitrage between the COMEX price and the LME level.
The situation is aggravated by a supply crisis in the physical market. Chile’s output fell in February to its lowest monthly level in almost nine years (Bloomberg). At the same time a Middle East conflict has disrupted sulphur exports and triggered a sulphuric-acid shortage; Chinese acid exports to Chile stand still ahead of announced restrictions from May 2026 (BNamericas). Because sulphuric acid is indispensable for leaching oxide ores, an additional production shortfall looms, especially among smaller producers reliant on spot purchases.
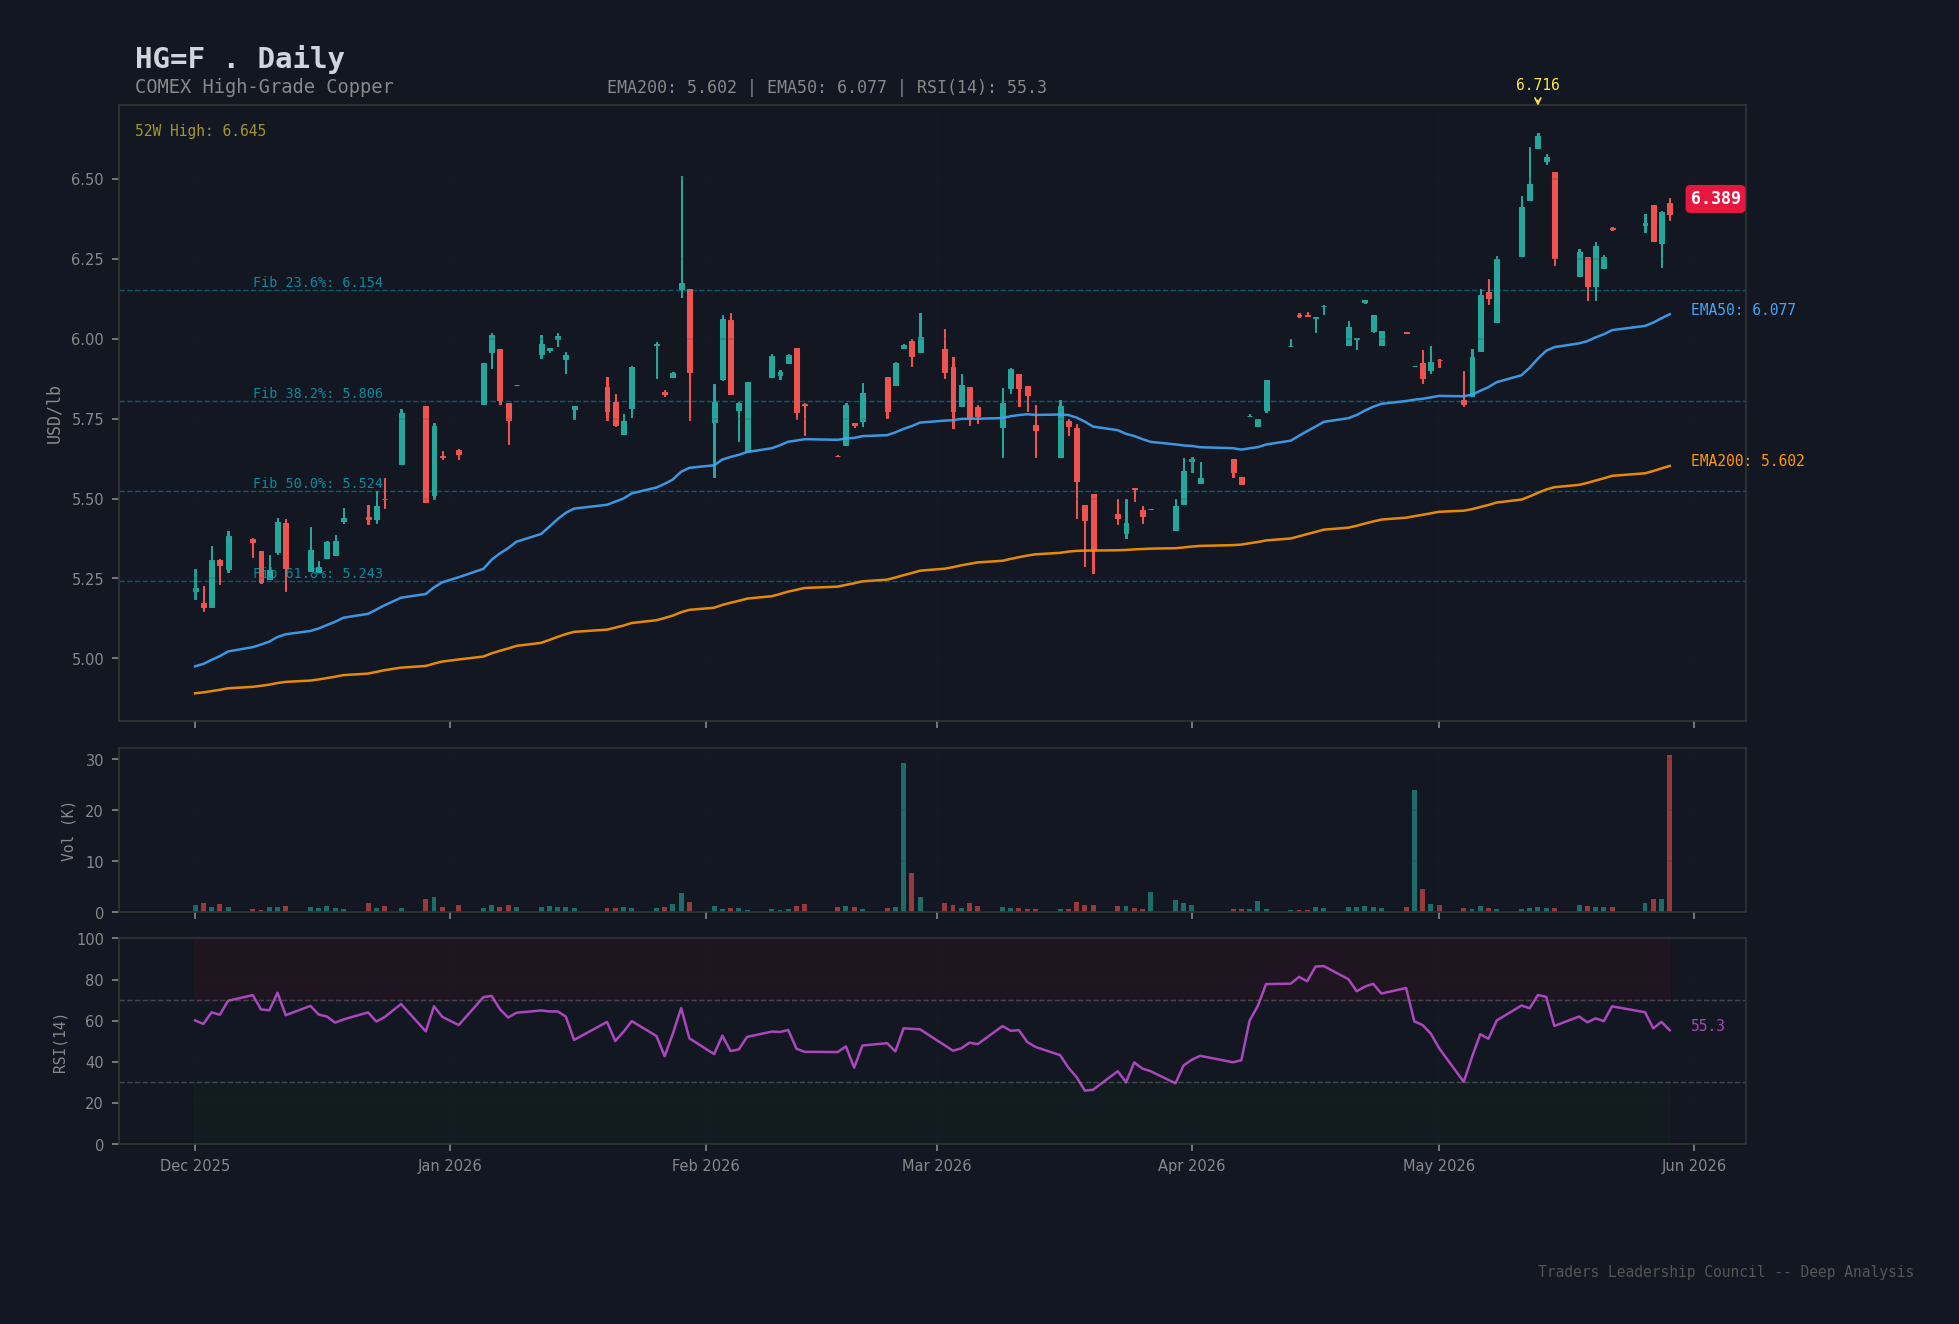
Chart Analysis
Technically, copper presents an intact uptrend. The price of 6.39 USD trades comfortably above the 50-day line at 6.154 USD and well above the 200-day line at 5.714 USD — the classic configuration of a bull market in which the short-term average sits above the long-term one. The relative strength index (14) stands at 55.84, in neutral-constructive territory: upward momentum without the warning signs of overheating, leaving room for further advances. Laying the Fibonacci grid over the span from the annual low of 4.33 USD to the high of 6.72 USD, the 23.6 percent retracement at around 6.15 USD acts as the first robust support — remarkably coincident with the 50-day line, making this zone a doubly secured floor. Below it lies the 38.2 percent level at 5.81 USD. On the upside, the twelve-month high at 6.72 USD forms immediate resistance; a daily close above it would technically open the path into three-figure LME regions.
Risk Factors
The most prominent risk is also the principal catalyst: the Section 232 decision at the end of June can cut both ways. Should Washington confirm the path toward universal duties on refined copper, the premium in the US market is likely to widen further; a dilution or postponement, by contrast, could abruptly unwind the built-up arbitrage and put long positions under pressure.
The second risk is monetary in nature. A resolutely restrictive Fed chair Warsh and a rate hike possibly still to come this year would support the dollar. A firmer greenback makes copper more expensive for foreign buyers and has reliably weighed on prices in the past — a counterweight that can temporarily overlay the fundamental scarcity narrative.
Third, there is a positioning risk. When over 87 billion dollars of mining-ETF assets, rather than the physical balance, set the marginal price, the market is vulnerable to abrupt shifts in sentiment. The revision of the ICSG balance from deficit to surplus shows how quickly the fundamental narrative can flip and how vulnerable purely narrative-driven price levels are.
Fourth, the demand side remains chained to China. Should the anticipated stimulus from Beijing fail to materialise or disappoint, a central pillar of demand would fall away. And finally, the sulphuric-acid crisis is price-supportive but volatile: an easing of the geopolitical situation or a reversal of Chinese export restrictions could let the supply shock fade faster than is currently priced in.
Outlook and Key Dates
The single most important date is 30 June 2026, when the US Commerce Department’s report on Section 232 duties on refined copper falls due — the decision will set the direction for the second half of the year. In parallel, the next meetings of the Fed under Kevin Warsh and any stimulus announcements from Beijing must be watched closely, as they set the macroeconomic sign through dollar strength and Chinese demand. Technically, it is at the 6.72 USD resistance that it will be decided whether the rally opens a new stage; on the downside the double holding zone around 6.15 USD remains the bulls’ line of defence. Goldman Sachs expects a slight correction from record levels in 2026 but sees the structural electrification trend intact (Goldman Sachs). Investors should treat the tariff deadline as a binary event and size their risk accordingly.
Source and Copyright: Traders’ Leadership Council, 2026.
The content published on this website is provided for general informational purposes only and does not constitute investment advice, a recommendation, or a solicitation to buy or sell any financial instrument. All analyses, assessments, and forecasts reflect the personal opinion of the authors at the time of publication and may contain errors or inaccuracies.
All investment decisions are made at the reader’s own risk. Past performance is not a reliable indicator of future results. Trading financial instruments involves significant risks and may result in total loss of invested capital. Readers should seek qualified, independent financial advice before making any investment decision.
The operator of this website and the authors accept no liability for losses or damages arising directly or indirectly from the use of or reliance on the content published herein.