USD/JPY — Between Rate Differentials and Intervention Fear: The Yen Under Structural Pressure
Date: April 27, 2026 | Current Rate: 159.23 | Change: −0.06% | Ticker: USD/JPY
The Asset in Context
The USD/JPY currency pair — often dubbed the “Godzilla of forex markets” — is far more than a simple exchange ratio between two currencies. It is the most concentrated expression of diverging monetary policy anywhere on the globe. While the Federal Reserve holds its benchmark rate at 3.50 to 3.75 percent with no meaningful signal of an imminent pivot, the Bank of Japan sits at 0.75 percent — a differential of roughly 300 basis points that drains institutional capital from Japan with gravitational force. Trading at 159.23 yen per dollar, the pair is approaching the psychologically and politically charged 160 threshold — a level at which Tokyo has previously deployed billions in market interventions. The question is no longer whether the next test will come, but when.
Macro Forces at Play
The macroeconomic constellation has barely shifted over the past year — and that is precisely the problem for the yen. The American economy continues to prove resilient: core inflation stood at 2.6 percent in March 2026 (U.S. Bureau of Labor Statistics), the overall unemployment rate declined to 4.3 percent, and the investment contribution to GDP growth rose to 0.4 percentage points in Q4 2025 — indicators that leave the Fed with scant justification for premature rate cuts. The U.S. current account deficit narrowed slightly to minus 3.6 percent of GDP, moderating some structural dollar demand from abroad without marking a trend reversal.
Japan tells an altogether different story. The economy grew at a mere annualised rate of 1.3 percent in Q4 2025 (Cabinet Office Japan), recovering from a sharp contraction of 2.6 percent in the prior quarter. Core inflation — excluding fresh food — stood at 1.8 percent, while headline inflation continues to run above the Bank of Japan’s 2 percent target, driven by food prices and imported energy costs. Japan’s trade balance recovered to a surplus of JPY 667 billion (Ministry of Finance, Japan), but this apparent improvement largely reflects the weak yen’s distorting effect on import prices in local currency terms. Japan imports more than 90 percent of its energy needs; even with Brent crude falling from around USD 110 to USD 78 per barrel, the structural energy dependency remains a chronic drag on the current account and a persistent headwind for the currency.
BoJ Governor Kazuo Ueda, as expected, kept rates on hold at the April 26-27, 2026 meeting. Markets are pricing approximately 70 percent odds of a 25-basis-point hike to 1.00 percent at the June 14-15, 2026 meeting — supported by a third consecutive year of Japanese wage gains exceeding 5 percent in spring negotiations and real wage growth of 1.9 percent in February. Even if that hike materialises, the transatlantic interest rate gap would remain crushingly wide at 250 to 275 basis points.
Supply, Demand and Market Structure
The demand side for US dollars is structurally robust. Institutional investors globally — above all Japanese life insurers and pension funds — hold massive dollar-denominated portfolios funded by cheap yen borrowing. This yen carry trade has, according to BCA Research, reached volumes that analysts describe as “unsustainable.” In February 2026, BCA explicitly warned that the risk-reward profile of the trade has deteriorated and that any yen appreciation, once it commences, is likely to be pronounced in magnitude — as Japanese insurers rush to raise hedge ratios. On the supply side, Japan’s Ministry of Finance maintains continuous verbal intervention, and currency chief Masato Kanda has indicated that 160 yen per dollar represents a de facto red line. Historical precedent from 2022 and 2024 — when Japan deployed over USD 90 billion in total market interventions — shows that such actions can compress the rate by three to five percent in the short term, but change nothing about the structural interest rate differential.
Geopolitics and Risk Landscape
The geopolitical dimension of the yen complex has grown considerably more intricate. U.S. trade policy under the “America First” agenda remains a persistent source of uncertainty that distorts global trade flows and directly hits Japan as an export-intensive economy. Meanwhile, tensions in the Middle East continue to cloud the energy price outlook; a renewed oil price spike would hit Japan disproportionately as a net energy importer, placing additional downside pressure on the yen. At the same time, the U.S.-China rivalry forces Japan into a delicate balancing act: an overly rapid yen appreciation through aggressive BoJ tightening would burden Japanese exporters — particularly the automotive sector — and would be politically difficult to justify domestically. The risk of a rapid carry trade unwind remains the paramount systemic tail risk: should the BoJ move more aggressively than expected or the Fed signal an earlier-than-anticipated easing, a chain reaction across global capital markets could follow — reminiscent of the August 2024 mini-crash triggered by an unexpected BoJ rate increase.
Chart Analysis
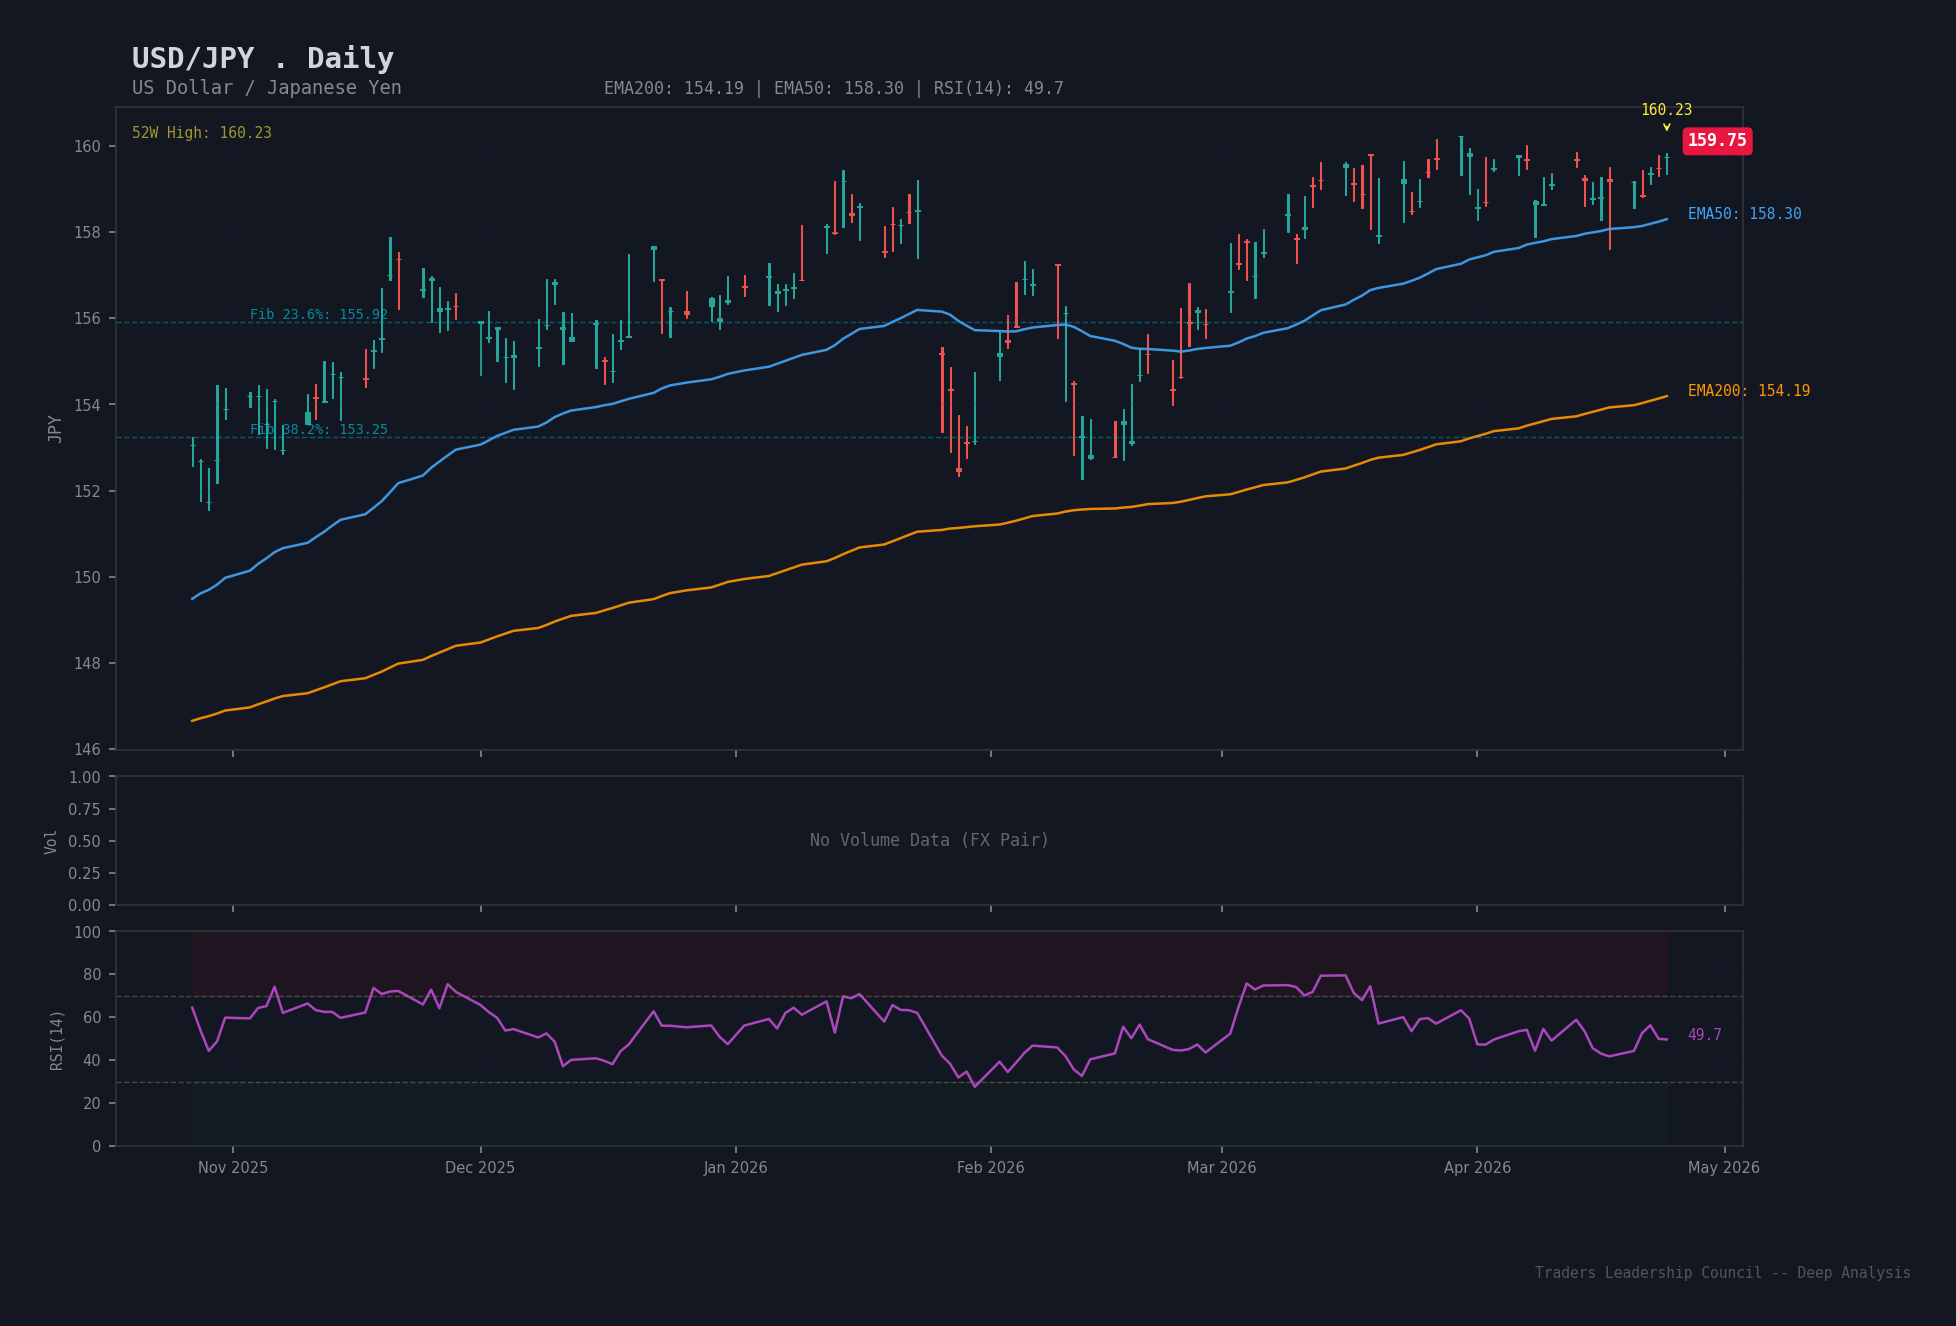
The technical picture for USD/JPY is unambiguous: the pair is in a well-established uptrend. The 200-day exponential moving average (EMA200) stands at 154.39, the EMA50 at 158.38 — both substantially below the current price, confirming a bullish trend across all standard timeframes. The 52-week low was set on April 28, 2025 at 141.96; the 52-week high stands at 160.23, hit in April 2026. The current rate trades just below that multi-year peak. Fibonacci retracement levels drawn from the annual low to the annual high mark potential pullback zones: the 23.6 percent level sits at 155.92, the 38.2 percent level at 153.25 — these zones would represent the first technical support floors in the event of an intervention-induced correction. The RSI(14) at approximately 85 is firmly in overbought territory, making short-term profit-taking or volatile consolidation the most likely near-term outcome. Immediate resistance lies at 160.00 (psychological) and 161.45 (chart confirmation); immediate support at 158.70 and 156.45.
Risk Factors
The single largest risk to a long USD/JPY position is a coordinated currency intervention by Japan’s Ministry of Finance in conjunction with the Bank of Japan. Japan has intervened at or around the 160 level in the past; domestic political pressure mounts with each successive yen weakness print. Such intervention could push the exchange rate down three to six percent within hours.
A second material risk is a hawkish surprise from the Bank of Japan — for example a 50-basis-point hike rather than 25, or a signal of an accelerated tightening path. Polymarket data shows less than 2 percent implied probability for a 50-basis-point hike in June; even if it remains unlikely, verbal escalation alone would activate massive yen long positions with significant speed.
On the opposite side, any deterioration in U.S. economic data that compels the Fed to pivot earlier than discounted would swiftly erode the dollar’s yield advantage. Rising unemployment or a material decline in inflation expectations could alter the rate differential narrative within weeks. The overbought RSI also leaves the pair exposed to rapid technical corrections, particularly during thin trading sessions.
Finally, the systemic carry trade risk persists. A gradual, orderly yen strengthening is something markets can absorb — an abrupt appreciation event, as witnessed in August 2024, would destabilise globally leveraged portfolios and trigger contagion effects well beyond the foreign exchange arena.
Outlook and Key Dates
The base case for USD/JPY over the next three months is a volatile sideways range of roughly 156 to 162 — driven higher by the structural interest rate differential, capped by the rising intervention risk above 160. The Bank of Japan’s June 14-15, 2026 meeting is the next critical inflection point: a hike to 1.00 percent is priced at 70 percent odds and could temporarily strengthen the yen by 200 to 400 basis points. The U.S. non-farm payrolls release (first Friday of May) and the June Fed meeting remain indispensable reference points for the rate path narrative. Investors should treat the 160 level as a hypersensitive zone requiring appropriate hedging disciplines.
Source and Copyright: Traders’ Leadership Council, 2026.
The content published on this website is provided for general informational purposes only and does not constitute investment advice, a recommendation, or a solicitation to buy or sell any financial instrument. All analyses, assessments, and forecasts reflect the personal opinion of the authors at the time of publication and may contain errors or inaccuracies.
All investment decisions are made at the reader’s own risk. Past performance is not a reliable indicator of future results. Trading financial instruments involves significant risks and may result in total loss of invested capital. Readers should seek qualified, independent financial advice before making any investment decision.
The operator of this website and the authors accept no liability for losses or damages arising directly or indirectly from the use of or reliance on the content published herein.